DataScience310
For the final project I will be exploring the statistics associated with baseball. More particularly a study of newer statistics, launch angles and exit velocity. The goal of this project is to study the optimal launch angle and exit velocity and to compare different models on their predictive power. The value that will be predicted is slugging percentage. This is found through the following formula: (1B + (2B* 2) + (3B* 3) + (4B* 4))/AB. This problem is important because it is a new field of study in baseball and more data on the matter will result in better baseball overall. The complex nature of this project is that there is not a truly perfect way to predict the outcome of a baseball at-bat. This will merely provide insight into launch angle and exit velocity statistics. It will hopefully give a better insight into what statistics are valuable for batted balls. The central research question of this research is “What is the most optimal launch angle and exit velocity for a batter, and which machine learning model is the best at predicting the outcomes of at-bats?”
The data being used for this project is from Baseball Savant. They are the leaders in launch angle and exit velocity statistics. The data was seperated into two csv files, one for launch angles and one for exit velocity. They include the outcome for all at-bats from the 2019 season. There is more recent data available, but this is the most recent completed full season. The different features of this data include hits, at-bats, average, weighted on base average, singles, doubles, triples, home runs, and the averages for the four hits. I did not use singles, doubles, triples, and home runs as I wanted to challenge the models on their accuracy and not have the results which could be used to calculate the slugging percentage. The class of the data is continuous. For the datasets, there are an equal number of columns for both launch angle and exit velocity, 13, but a different number of rows. For launch angle, there are nearly 180 rows ranging from values -89 to 89 measured in degrees. For exit velocity there are just over a hundred row observations measured in miles per hour. The data was collected from baseball games played in the 2019 season and is highly relevant to the investigation.
For this project, I used three different machine learning models and compared them against each other for performance. The three models are linear regression, decision tree regressor, and a neural network. Below is the code for the implentation of each of the models.
Linear Regression
lr = LinearRegression().fit(X_train,y_train)
pred = lr.predict(X_test)
Decision Tree Regressor
dtr = tree.DecisionTreeRegressor()
dtr = dtr.fit(X_train, y_train)
pred = dtr.predict(X_test)
Neural Network
nn = MLPRegressor(max_iter=500).fit(X_train, y_train)
pred = nn.predict(X_test)
For each of these models, there was a split of training and testing data using sklearn’s train_test_split function. The code in practice had a few sections, many of which did the same thing. The first section processed the data and calculated the slugging percentage for each exit velocity and launch angle. From this, I was able to find the highest slugging percentage for each with a minimum of 10 at-bats. After this was found, I set up the test/training data and created the models. From these I was then able to calculate the mean squared error and R2 score. This will be explored in the next section of this report.
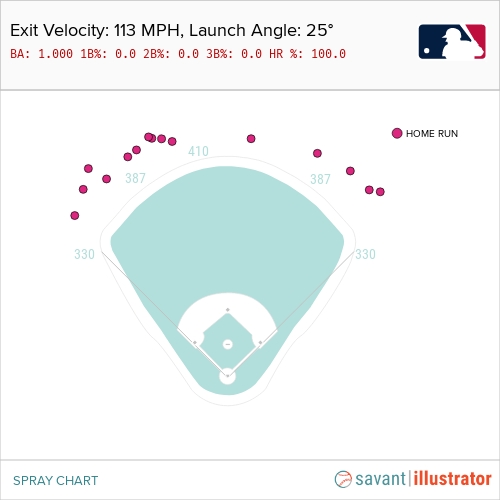
The results of the first question, what the optimal launch angle and exit velocity came out to be 25 degrees and 113 mph. These were each individually the highest slugging percentages. When compared to data from the baseball savant website, it appears to be a great prediction with a slugging percentage of 4, a perfect score. Below is an image from the baseball savant website which displays the outcome.

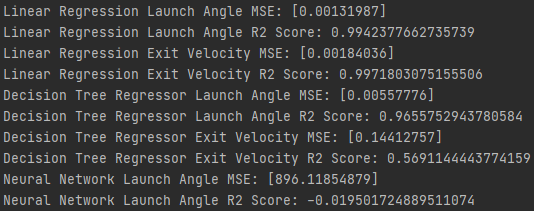
For the rest of the models I found that the linear regression was the most accurate at predicting the slugging percentage. This came as a little of a shock to me, as I predicted the neural network would be the most accurate, but the results showed that for both the launch angle and the exit velocity the linear regression was the best. Below are the MSE and R2 values for one run of each of the models.


With more time on this project, I would hope to be even more accurate. Perhaps if I had included the singles, doubles, triples, and home runs into the training data there would have been a perfect prediction, as the models would have all the values neccessary to compute slugging percentage. With more time, and more training I believe the models could become more accurate, but as they stand now, these are very accurate models.
There is not much in the realm of research on the topic of machine learning and launch angles and exit velocity. It is a fairly new statistic in the world of baseball, and only a few papers have been done on the topic. One in particular that was relatively similar to my research was done by Sean Morash. He did research in 2016 using launch angle and exit velocity to predict slugging percentage. Using the data he was able to see whether players were living up to their expectations or underperforming. I believe my research could be used in tandom with Morash’s to better predict slugging percentage. Due to the fact that the linear regression was the most successful model, I suggest future research should be done using linear regression models to predict slugging percentages. This would be a great future research project which could help teams decide which players to sign, trade, and let go. Below is a link to Morash’s paper which gives great insight into the usefulness of launch angles and exit velocity.
https://www.offthebenchbaseball.com/2016/05/19/can-new-data-on-launch-angles-and-exit-velocities-predict-future-results-introducing-xslgbb/